Chapter 5 Data Visualization
Prerequisites
Ensure you have completed all the steps in the following documents before continuing:
Create a Demo Dashboard in DGLux
- Open the remote broker built-in DGLux5 dashboard tool web interface at
https://R_BROKER_IP:8443(replacingR_BROKER_IPwith your remote broker’s public IP address)
Log in again via the
/efm-adminpage as theefmAdminuser if ano project specifiederror message appears.
Normally the first time you connect to the DGLux dashboard tool it will prompt you to install a license. For the lab environment this step has already been done for you. DGLux is licensed separately from Kinetic EFM. There are free 180-day trial licenses available for demos and testing.
DGLux is used here to show the power of EFM and give an example of how to extract and visualize operational data from the system. Many customers have their own operations visualization tools and may opt to use those rather than something like DGLux.
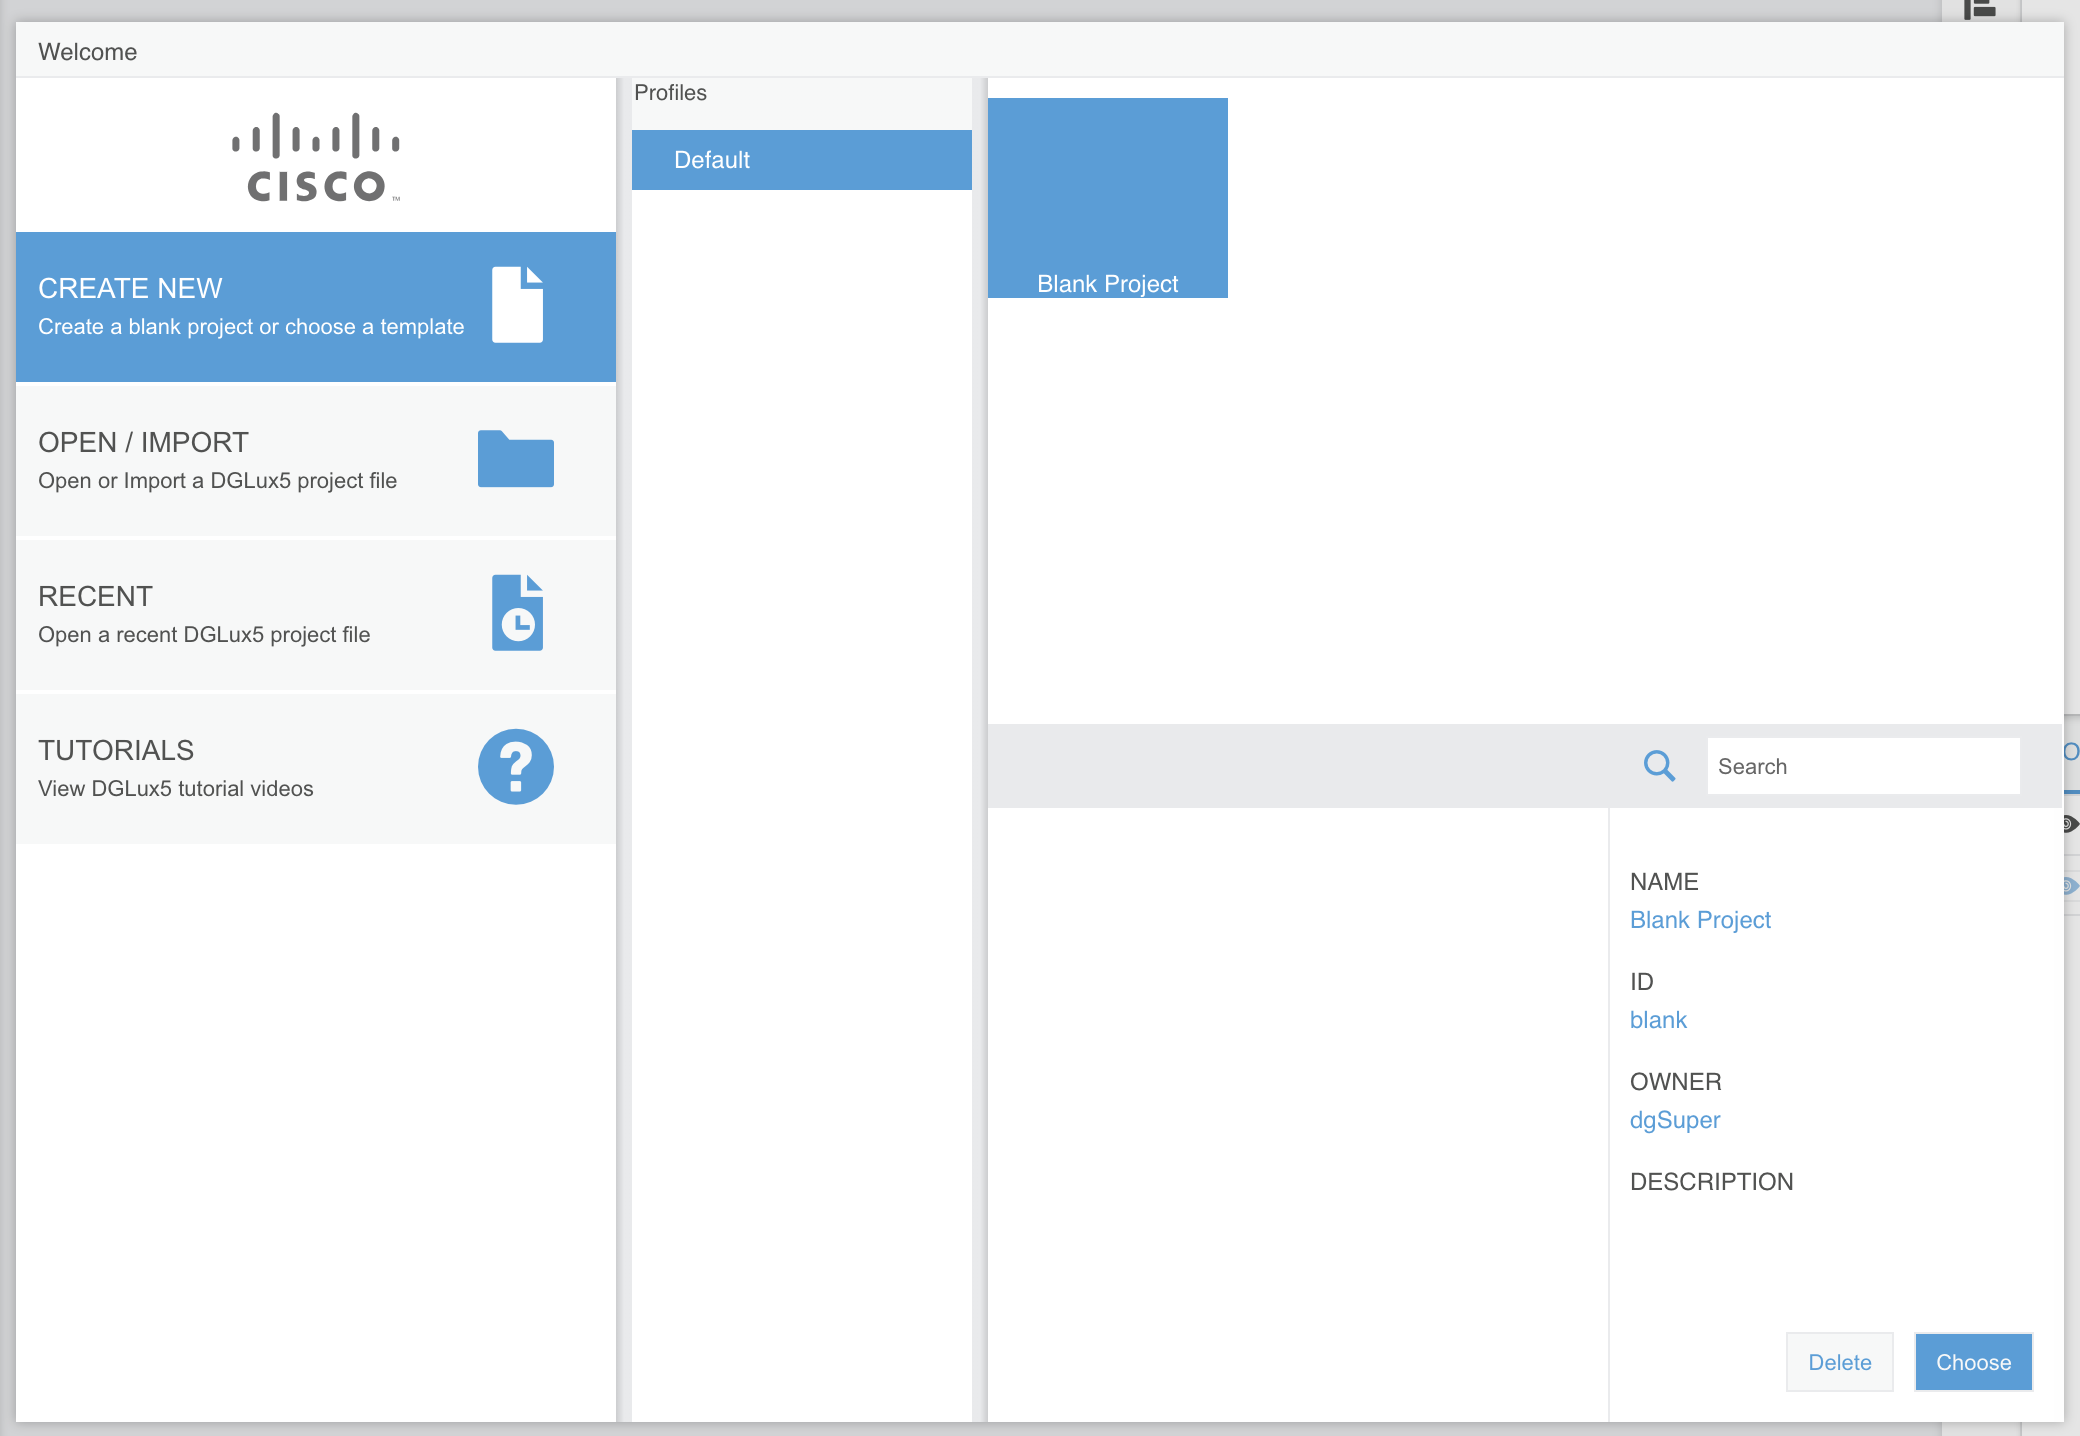
- Click
I Agreewhen prompted to accept the DGLux5 End User License Agreement - Select
CREATE NEW > Default > Blank Project - Click
Choose
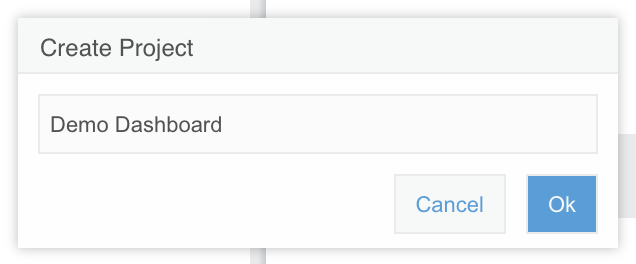
- Enter
Demo Dashboardfor the project name and clickOK
DGLux is a powerful, complicated tool. Rather than spend time trying to learn it, you are going to import an existing dashboard to get started as quickly as possible. If you have extra time at the end of the lab, feel free to make a copy of the dashboard or create a new DGLux project if you are interested in becoming more familiar with the tool.
- Download the following files for the dashboard:
- The Cisco logo available here
You may have to manually save this to your downloads folder as your web browser will want to display it inline.
- The DGLux Demo Dashboard file available here
- In the left-hand
Projectsection, select theDemo Dashboard > assetsfolder and click theUploadbutton
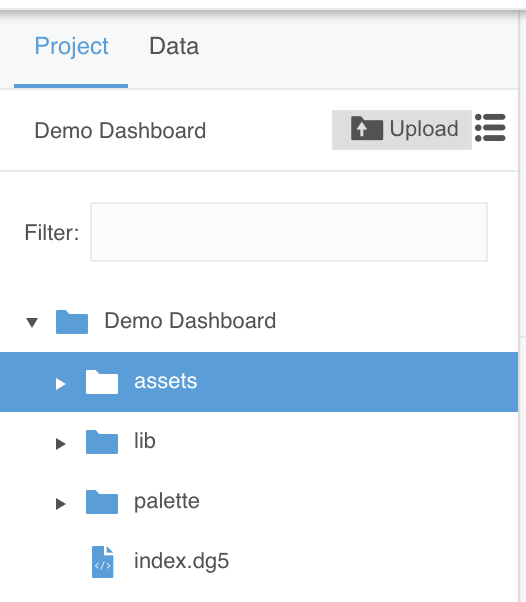
- Browse to the
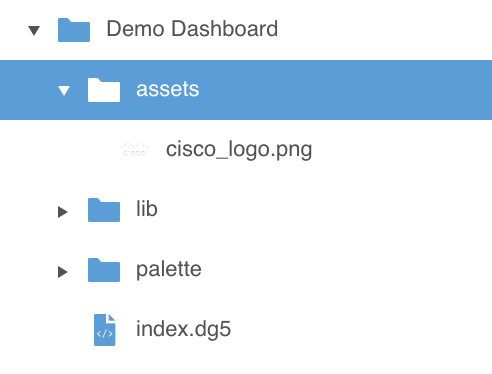
cisco_logo.pngfile you downloaded and clickOpen - The logo file should now appear under the
assetsfolder
- In the left-hand
Projectsection, select theDemo Dashboardfolder and click theUploadbutton again - Browse to the
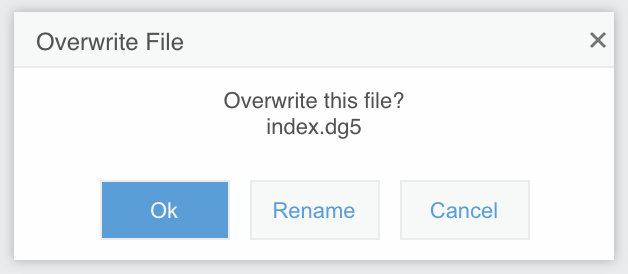
index.dg5file you downloaded and clickOpen - Click
Okwhen prompted to overwrite the existingindex.dg5file
- Double-click the
index.dg5file in the left-handProjectlist to view the dashboard in the editor - Click the light-gray dashboard background and expand the
Stageentry under theOutlinesection on the right-hand side
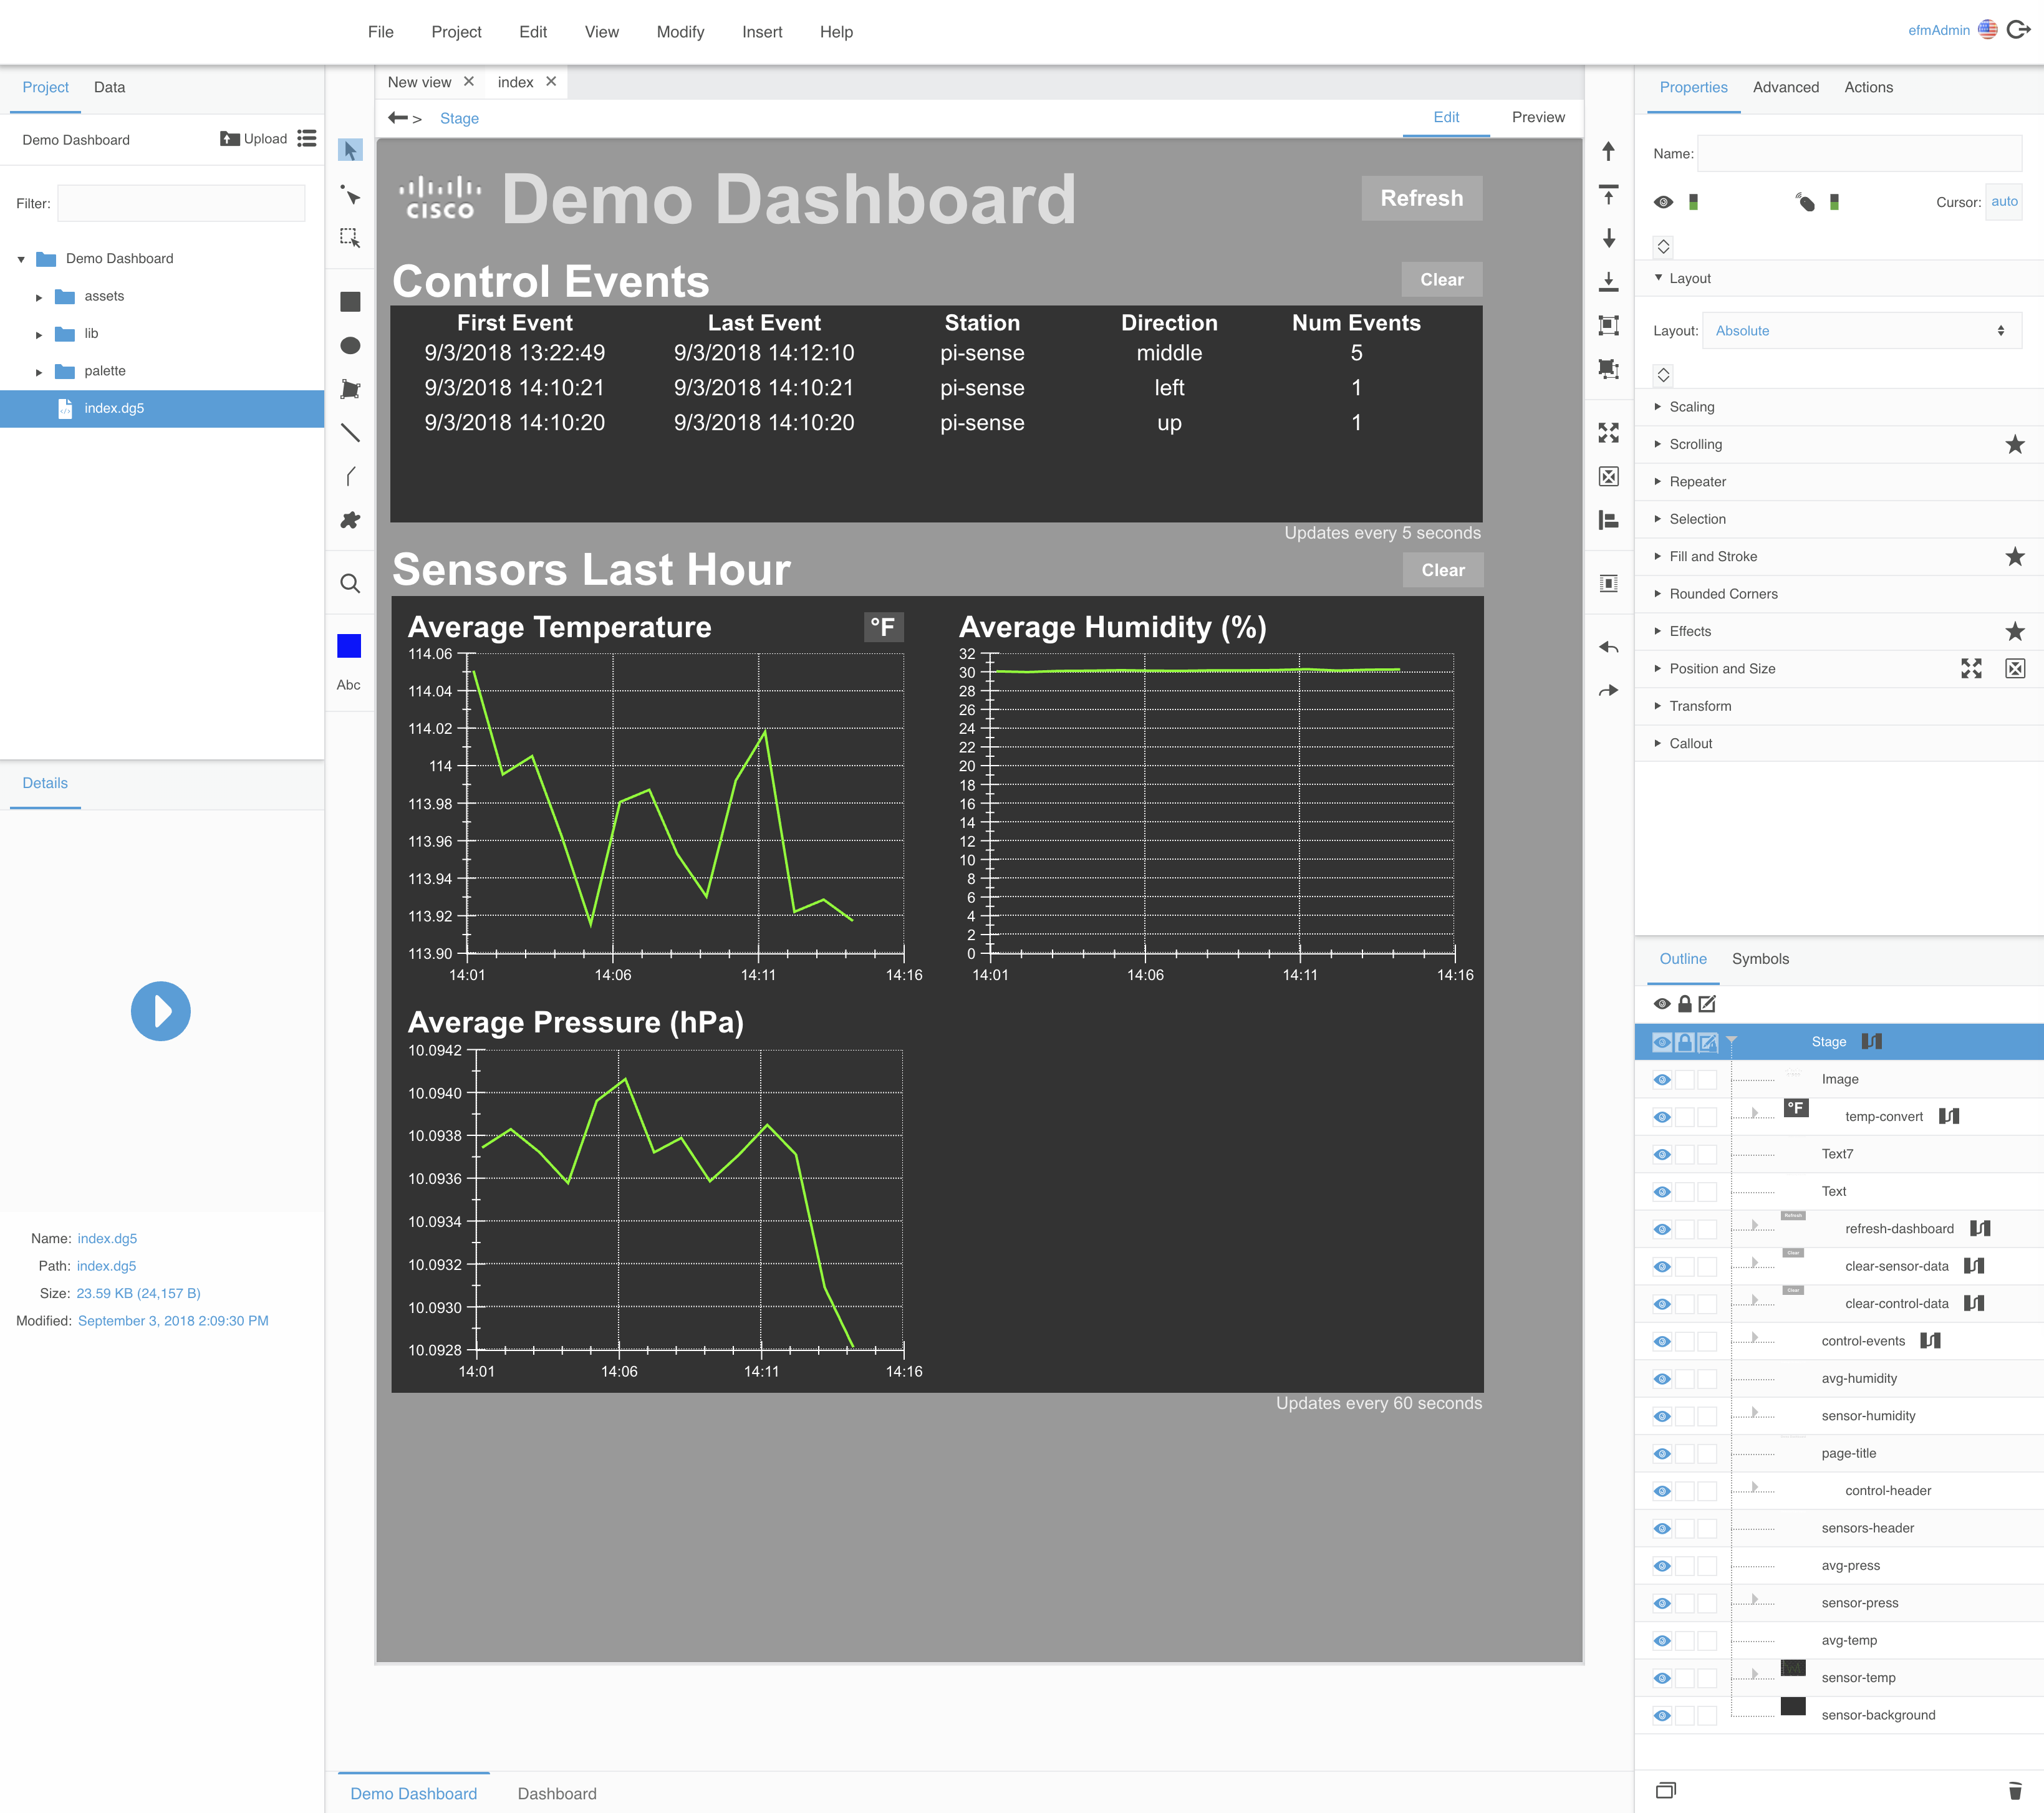
Feel free to click on any of the dataflow icons and explore the DGLux interface to see what went into creating this example dashboard. Be careful not to make any changes that could break the dashboard functionality.
- Browse to the live Demo Dashboard which should now be available at
https://R_BROKER_IP:8443/viewer.html?proj=Demo%20Dashboard(replacingR_BROKER_IPwith your remote broker’s public IP address)
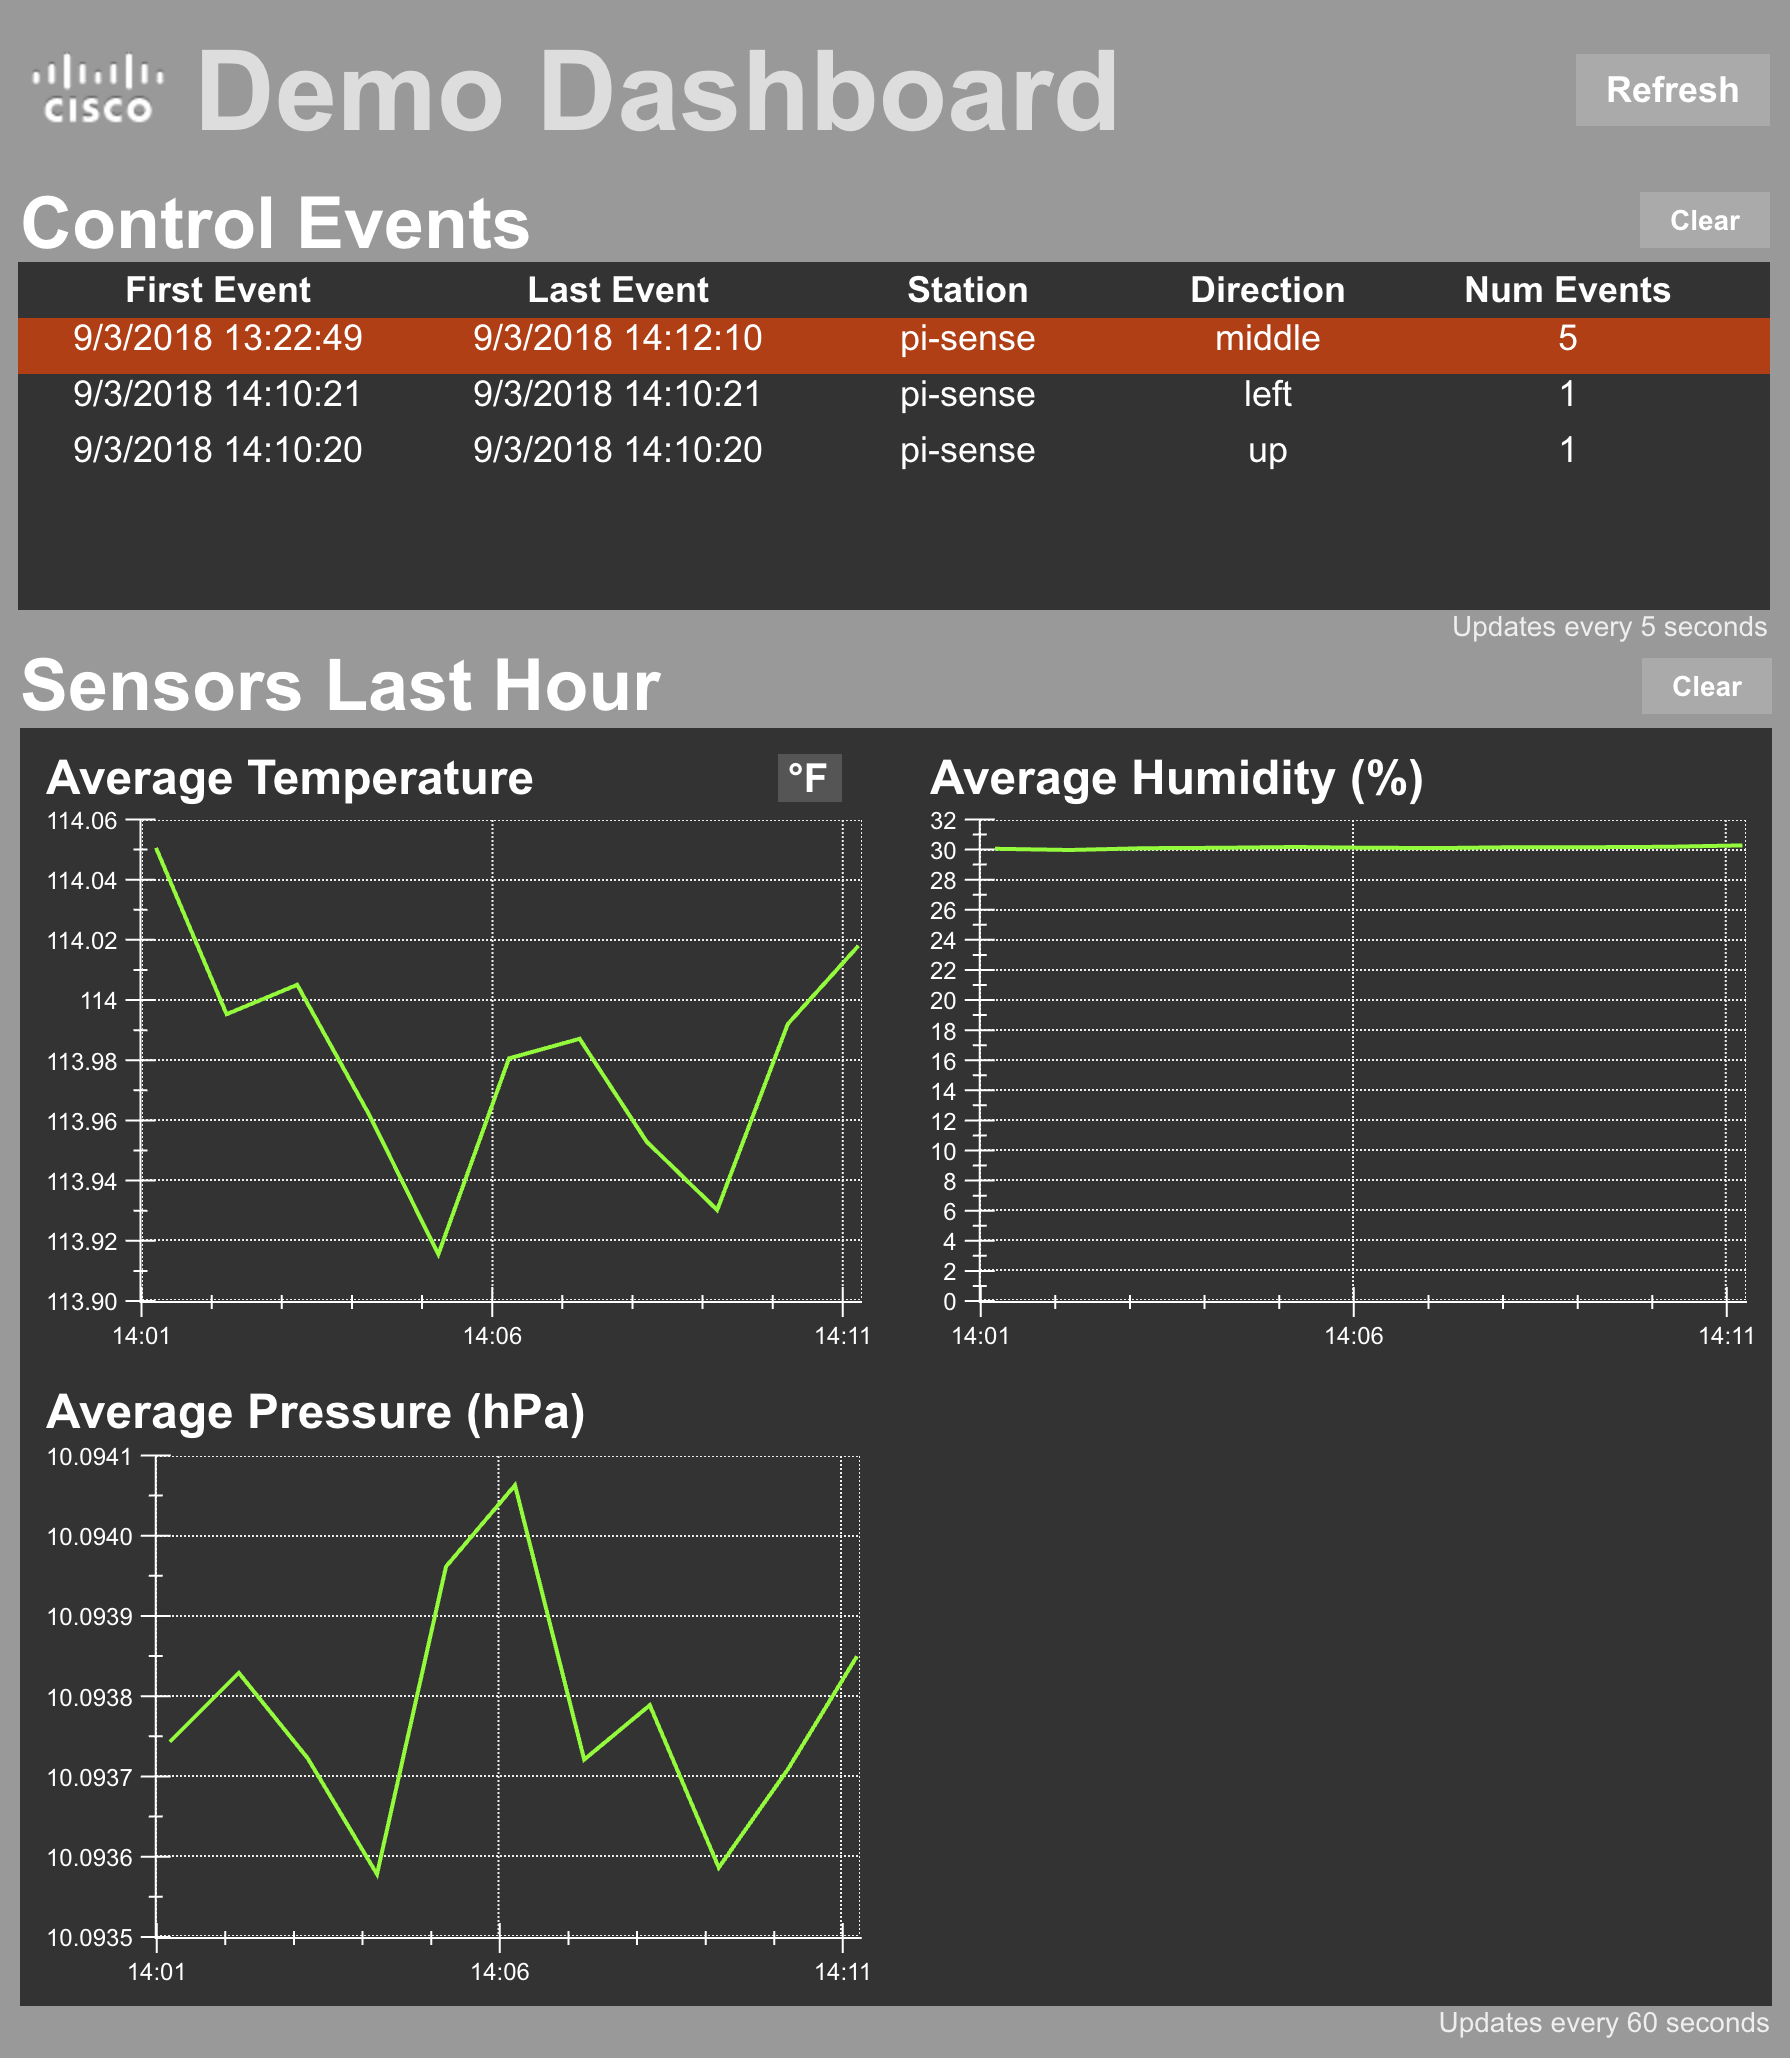
The sensor graphs should update every 60 seconds. Actuating the Sense HAT joystick should trigger updated counts and highlighted rows in the
Control Eventstable. If any of these aren’t updating or don’t look correct, double-check the related steps in the previous chapter Chapter 4 Remote Kinetic EFM Dataflows or ask the instructor for help if you get stuck.
- Close DGLux
On to Chapter 6 Next Steps